
What turnover costs you, and what closing the gap is worth.
Recreated demo · fictional data1:07 · Narrated · Captions in frame · 5 chapters
Diversity Impact Dashboard
What turnover costs you, and what closing the gap is worth.
Puts a dollar figure on above-benchmark turnover, then shows the cost falling as mentoring, sponsorship and resource-group coverage rise.
Built for a workplace-equity benchmarking firm. Status verified 10 Oct 2026.
Read the transcript
01 The Number
0:02 Every leadership team says inclusion matters, but few can say what their turnover gap costs.
0:08 This dashboard prices turnover above benchmark: an estimated $15.6 million a year in avoidable cost.
On screen: Estimate. The avoidable cost is turnover above benchmark.
02 Where the Money Goes
0:16 Most of it is replacing people who leave; the rest is ramp-up and lost know-how.
0:21 Every cost card shows its formula, so no cost is a black box.
On screen: Open formulas. Shown on every cost card.
03 Why People Leave
0:26 Turnover runs above benchmark at every level.
0:29 Women trail the benchmark in mentoring, sponsorship and manager promotions.
04 What If
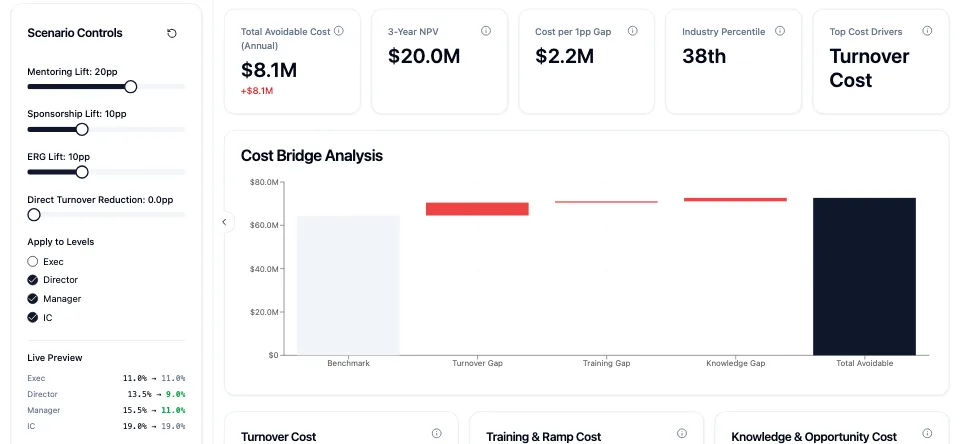
0:35 Raise mentoring coverage by 20 points, and the estimate falls to $10.6 million.
0:41 Expand sponsorship and resource groups, and it falls to an estimated $8.1 million.
0:47 Program effects are fixed planning assumptions, so this is an estimate, not a forecast.
On screen: Estimate. Program effects are fixed planning assumptions.
05 Where to Start
0:53 From your current numbers, it ranks five actions, with an estimated impact and payback.
On screen: Estimate. Five ranked actions, each with an impact and payback.
0:58 Diversity Impact Dashboard, built by Mambo for a benchmarking firm.
The problem
Inclusion Matters. Budgets Want a Number.
Leaders agree inclusion matters, but they hesitate to fund programs without a figure attached.
The business case lives in research papers, not in the company's own operating model, so HR can't say what the turnover gap costs or what closing part of it would be worth.
What it does
One Figure. Every Formula Visible.
The dashboard models a company's workforce by level: headcount, salaries, replacement costs, and current against benchmark turnover. It turns the gap into an annual avoidable cost, a three-year present value and a cost per point of turnover, with every formula visible. Sliders raise mentoring, sponsorship and resource-group coverage and show the estimate falling, and a rules engine lists the top actions with their estimated impact and payback.
- 01
One Avoidable-Cost Figure
Annual cost above benchmark, three-year present value and cost per point of turnover.
- 02
Open Formulas
Every cost card shows the formula behind it, and every assumption can be edited.
- 03
What-If Sliders
Raise program coverage and watch the estimate move across the charts.
- 04
Where the Gaps Are
Turnover by level, program participation gaps and promotion parity.
- 05
Ranked Actions With Payback
Up to five actions, each with an estimated impact and payback period.
What it doesn't claim
Estimates, Not Forecasts. Illustrative Data.
- Program effects use fixed planning assumptions, not measured results from any company.
- The demo runs on illustrative data; it has no upload, login or saved scenarios.
- The recommended actions come from the starting data and don't change with the sliders.
- There is no AI inside; every figure comes from visible formulas.
About this demo
Recreated in Code, With a Fictional Company.
The demo rebuilds the real dashboard with an invented building-products manufacturer and invented figures, starting with every program slider at zero so the change is easy to see. The benchmarking firm's brand is replaced with a fictional one.
In the demo
Five Chapters. Jump to Any One.
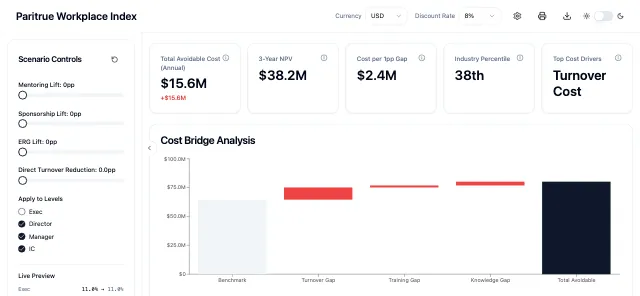 01 Play from 0:02: The Number
The Number
The annual cost of turnover above benchmark.
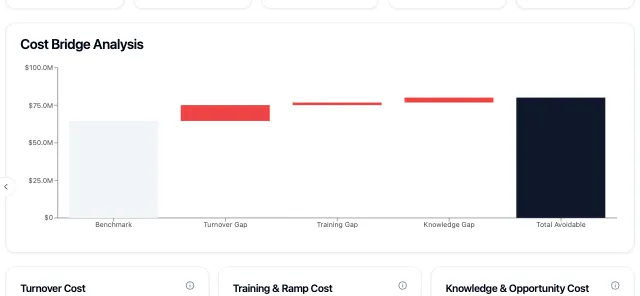 02 Play from 0:16: Where the Money Goes
Where the Money Goes
Turnover, ramp-up and lost know-how, with the formulas shown.
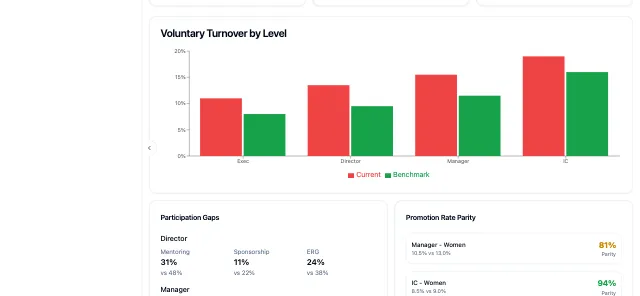 03 Play from 0:26: Why People Leave
Why People Leave
Turnover by level, participation gaps and promotion parity.
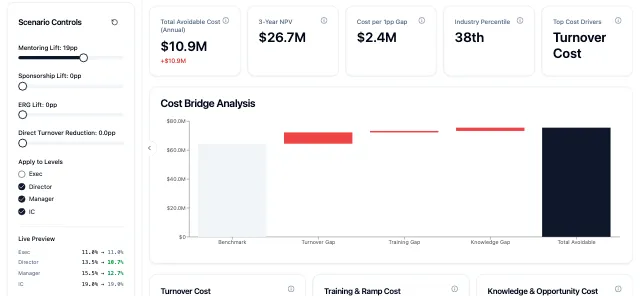 04 Play from 0:35: What If
What If
Program coverage raised, and the estimate falling.
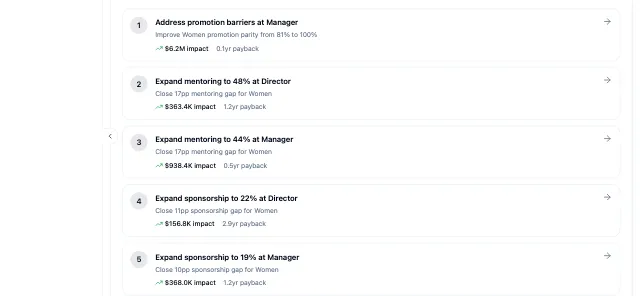 05 Play from 0:53: Where to Start
Where to Start
Ranked actions, each with an estimated impact and payback.
More from People Analytics
Same Benchmarks. Two More Ways to Use Them.
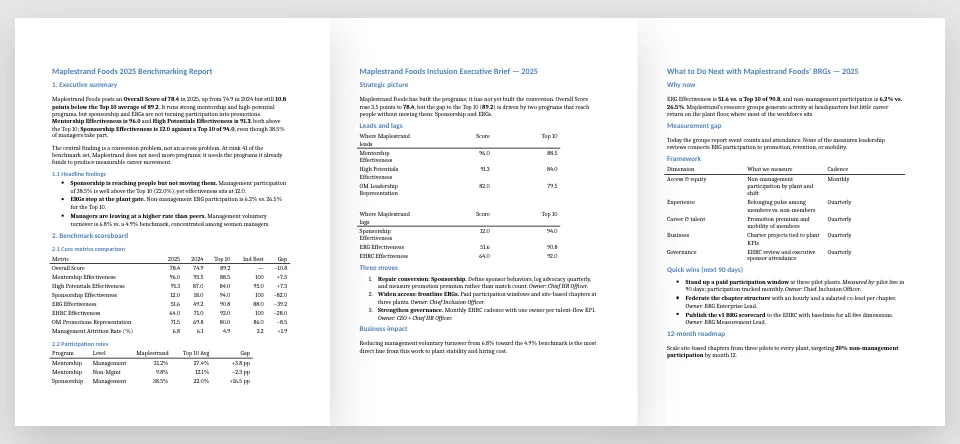
Benchmark Report Connector
Demo length 1 minute 6 secondsLiveApproved accounts onlyType one command in an AI assistant, name a company, and get three client-ready Word reports built from the firm's benchmark data.
Built for a workplace-equity benchmarking firm
Verified 10 Oct 2026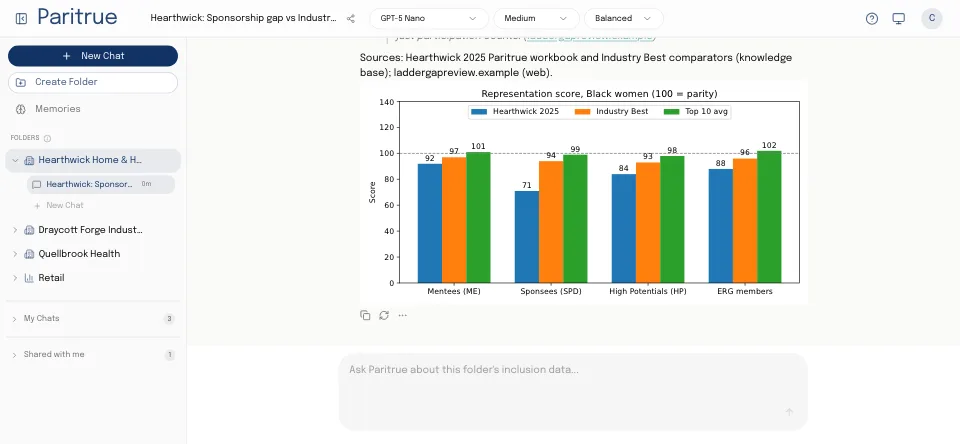
Equity Engine
Demo length 1 minute 3 secondsBuilt · pausedNo public accessAnswers plain-English questions about workplace-fairness data with a benchmark table, a chart and a cited source, and shows its steps.
Built for a workplace-equity benchmarking firm
Plainly
Delivered and verified in March 2026. Not running today.
Verified 10 Oct 2026
Put a Number on It. Then Close the Gap.
Tell us what your team can't see today. We'll show you the closest thing we've already built.