All products
Product · 08 / 19
Call Tracking Intelligence
Deployment unreachableFor: Wyoming Corporate Services · WCS Call tracking
Turns every inbound call into classified pipeline intelligence.
Cloud Run service is gone — the URL fails to connect (curl 000), not just a login gate
What it does
How it works.
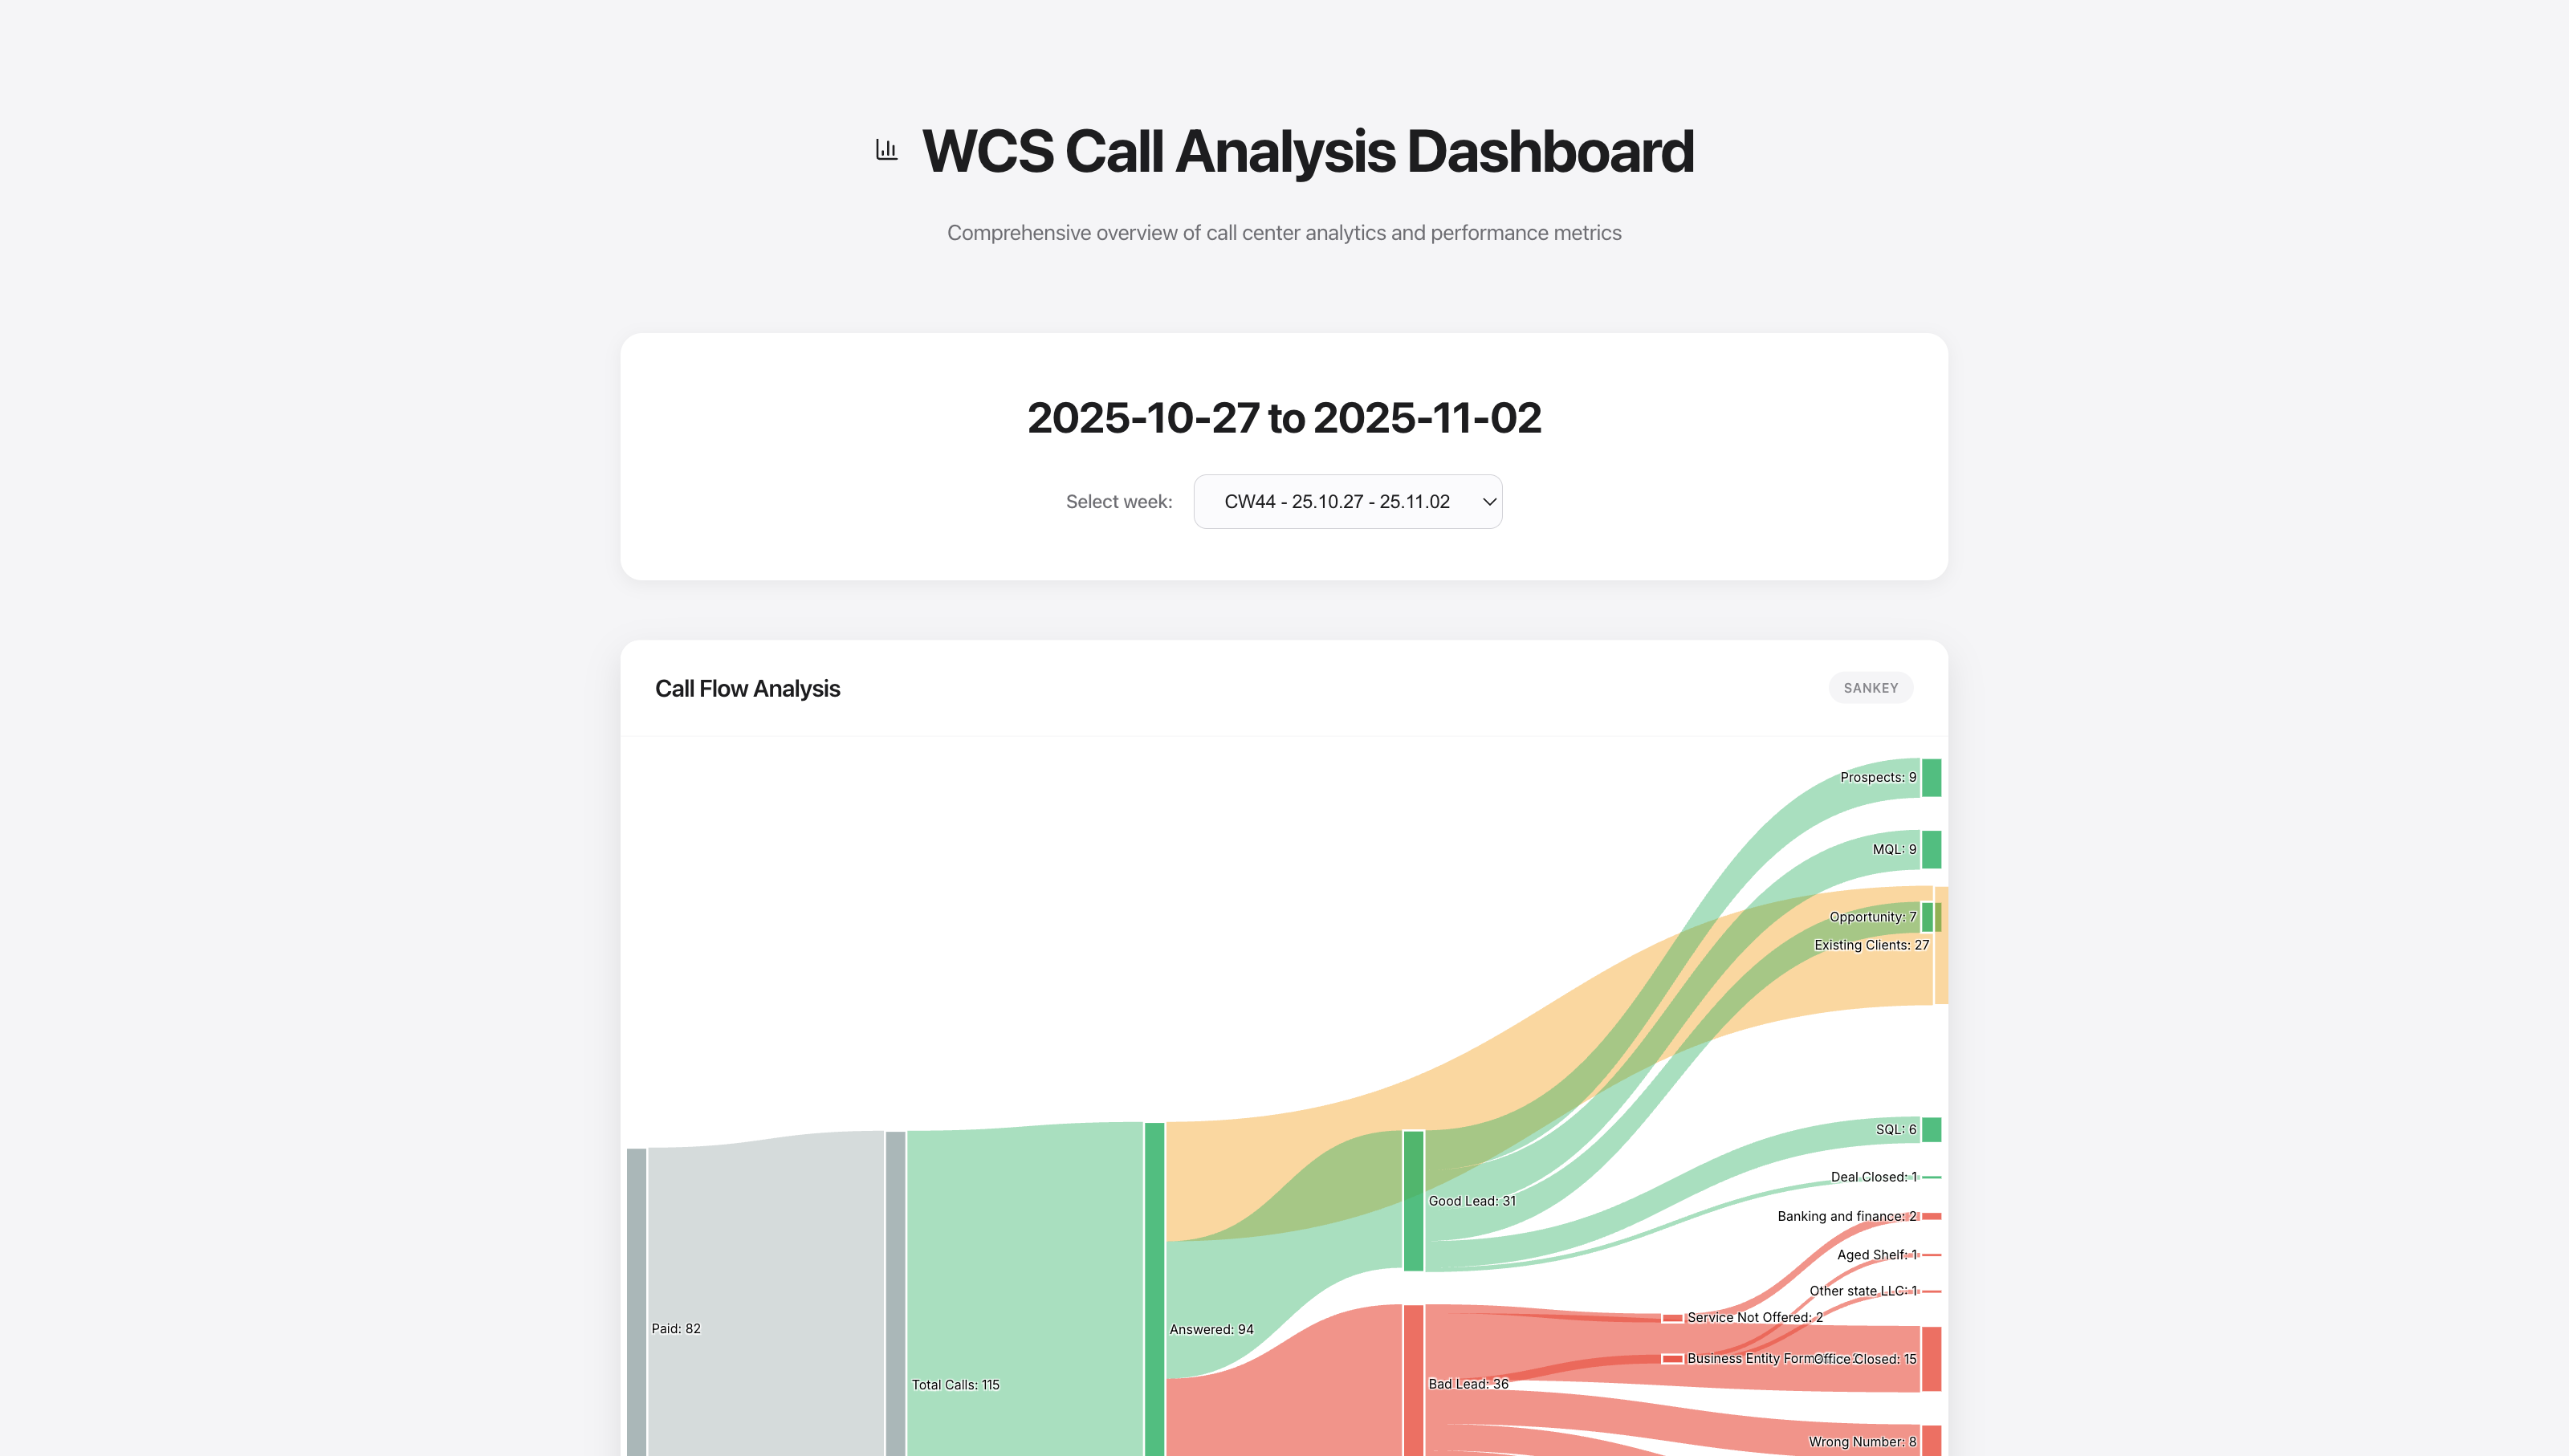
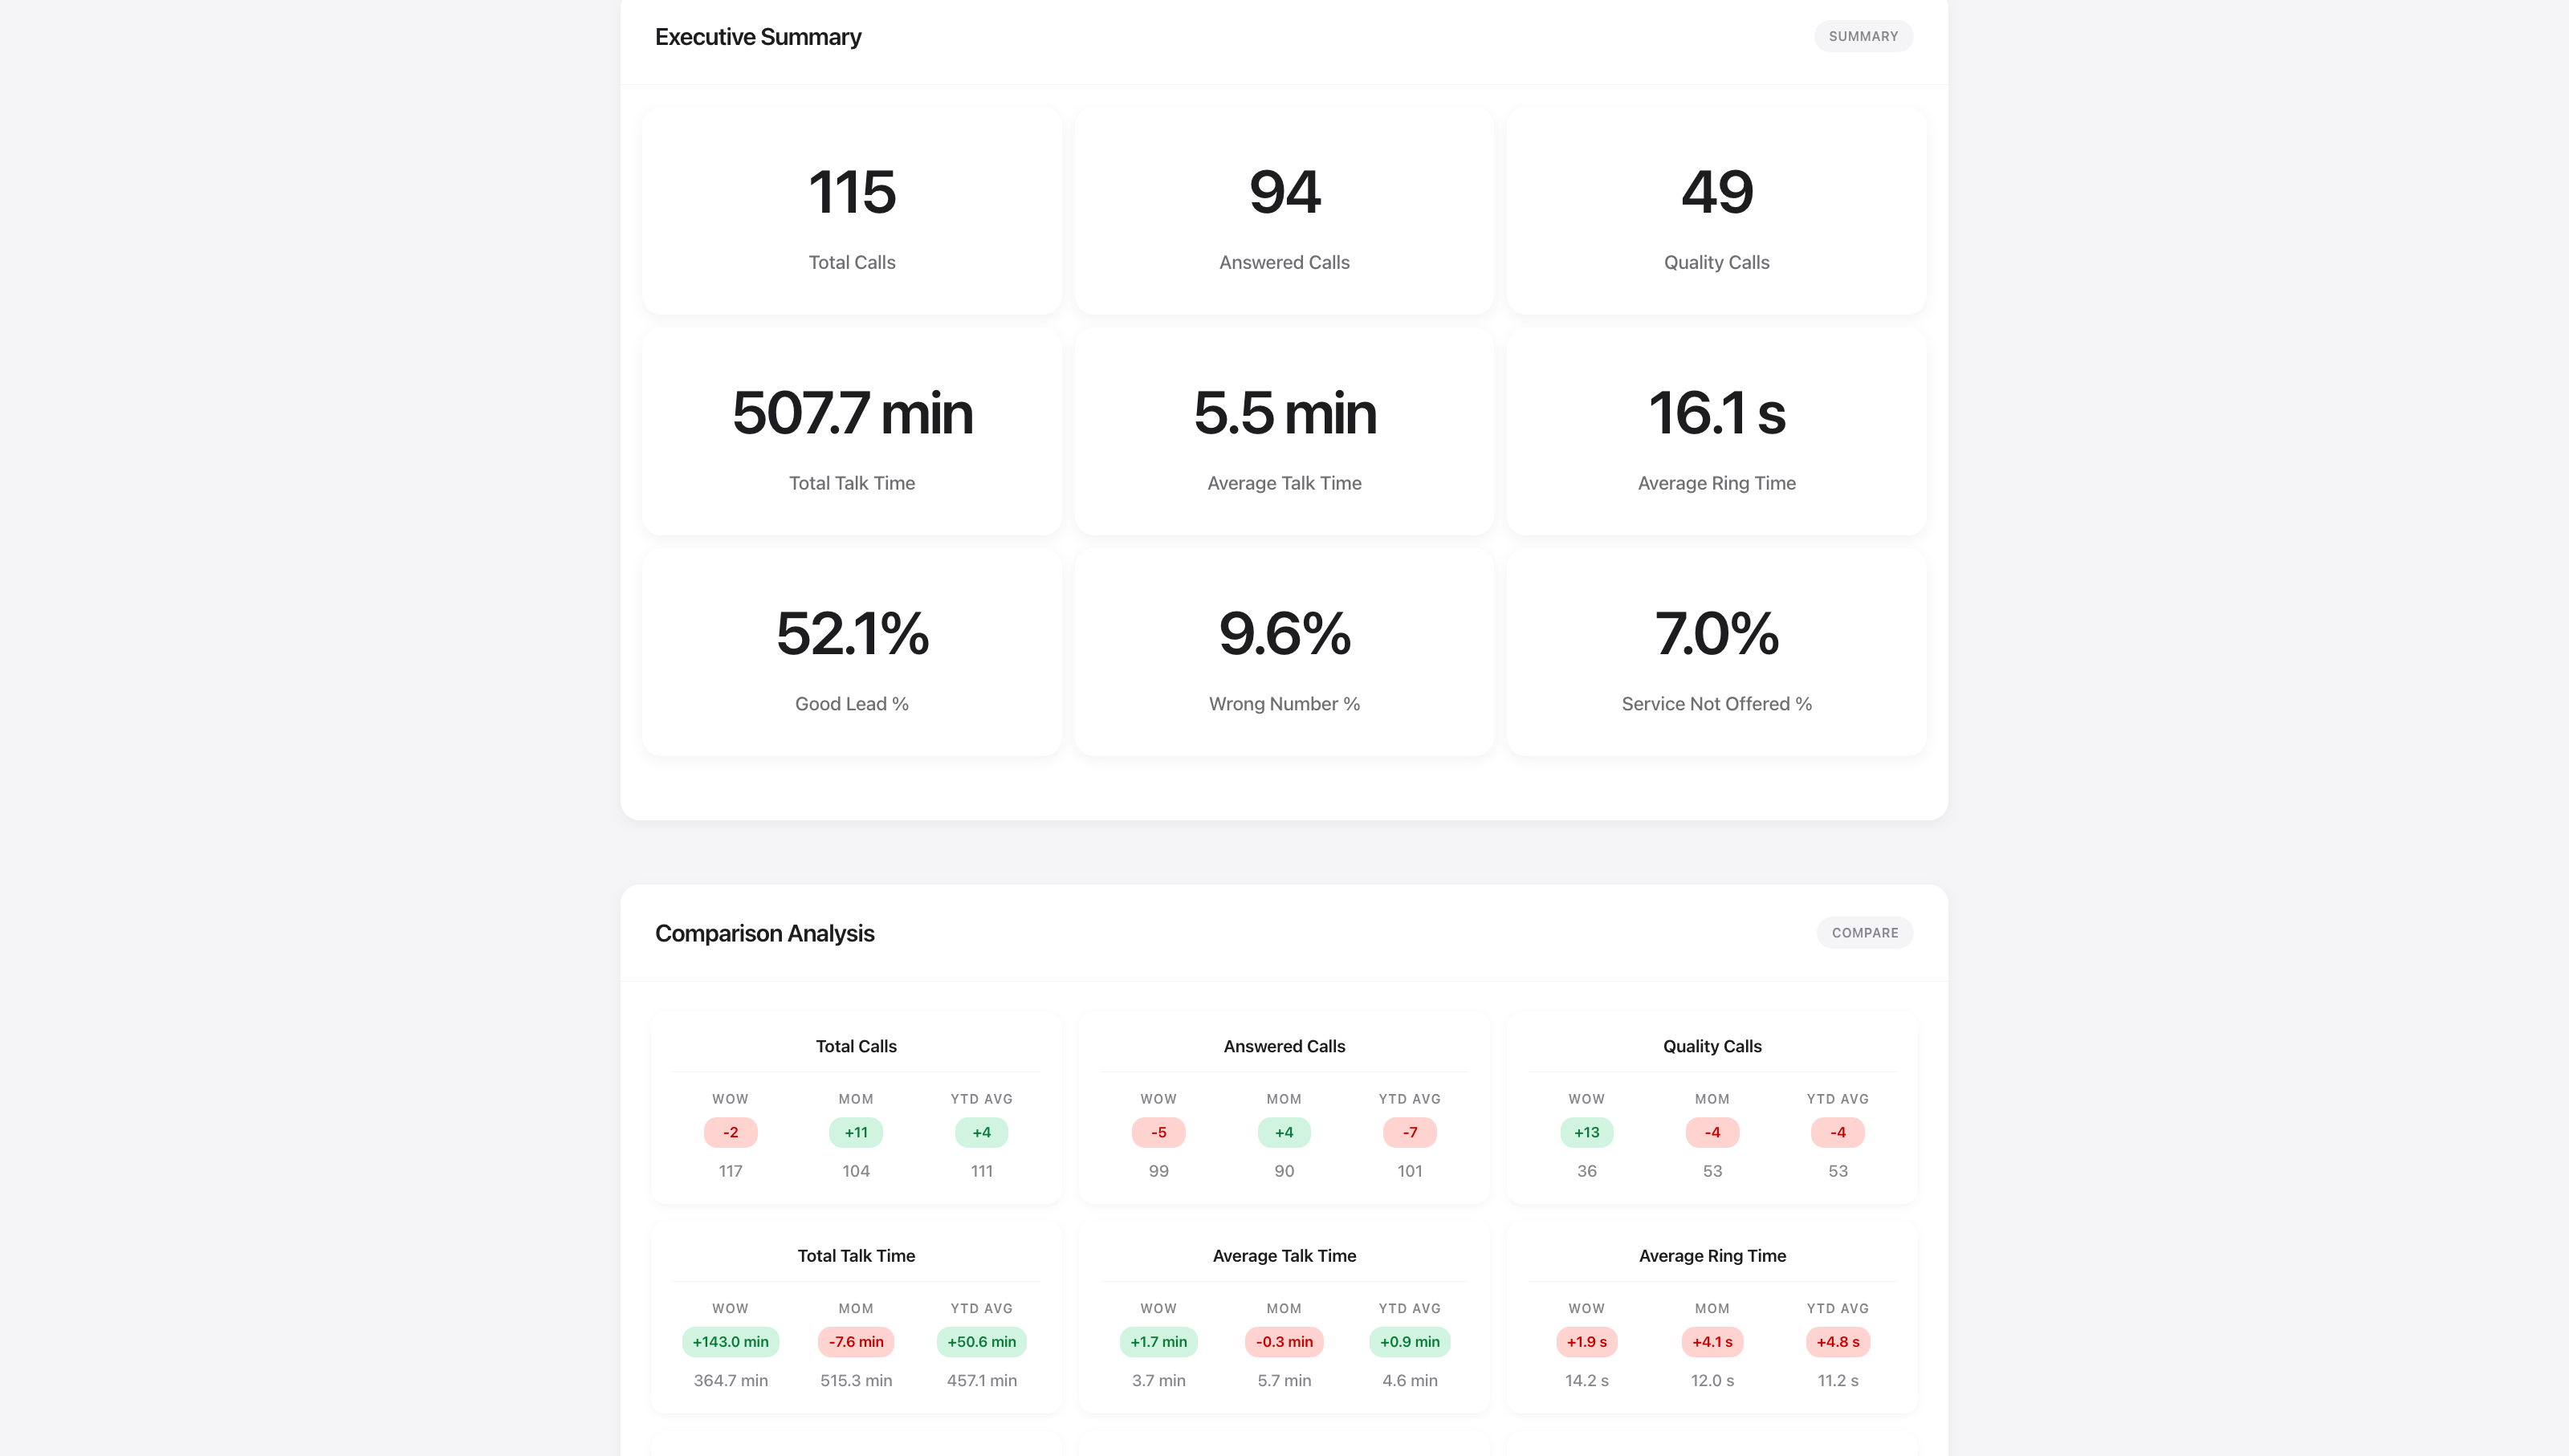
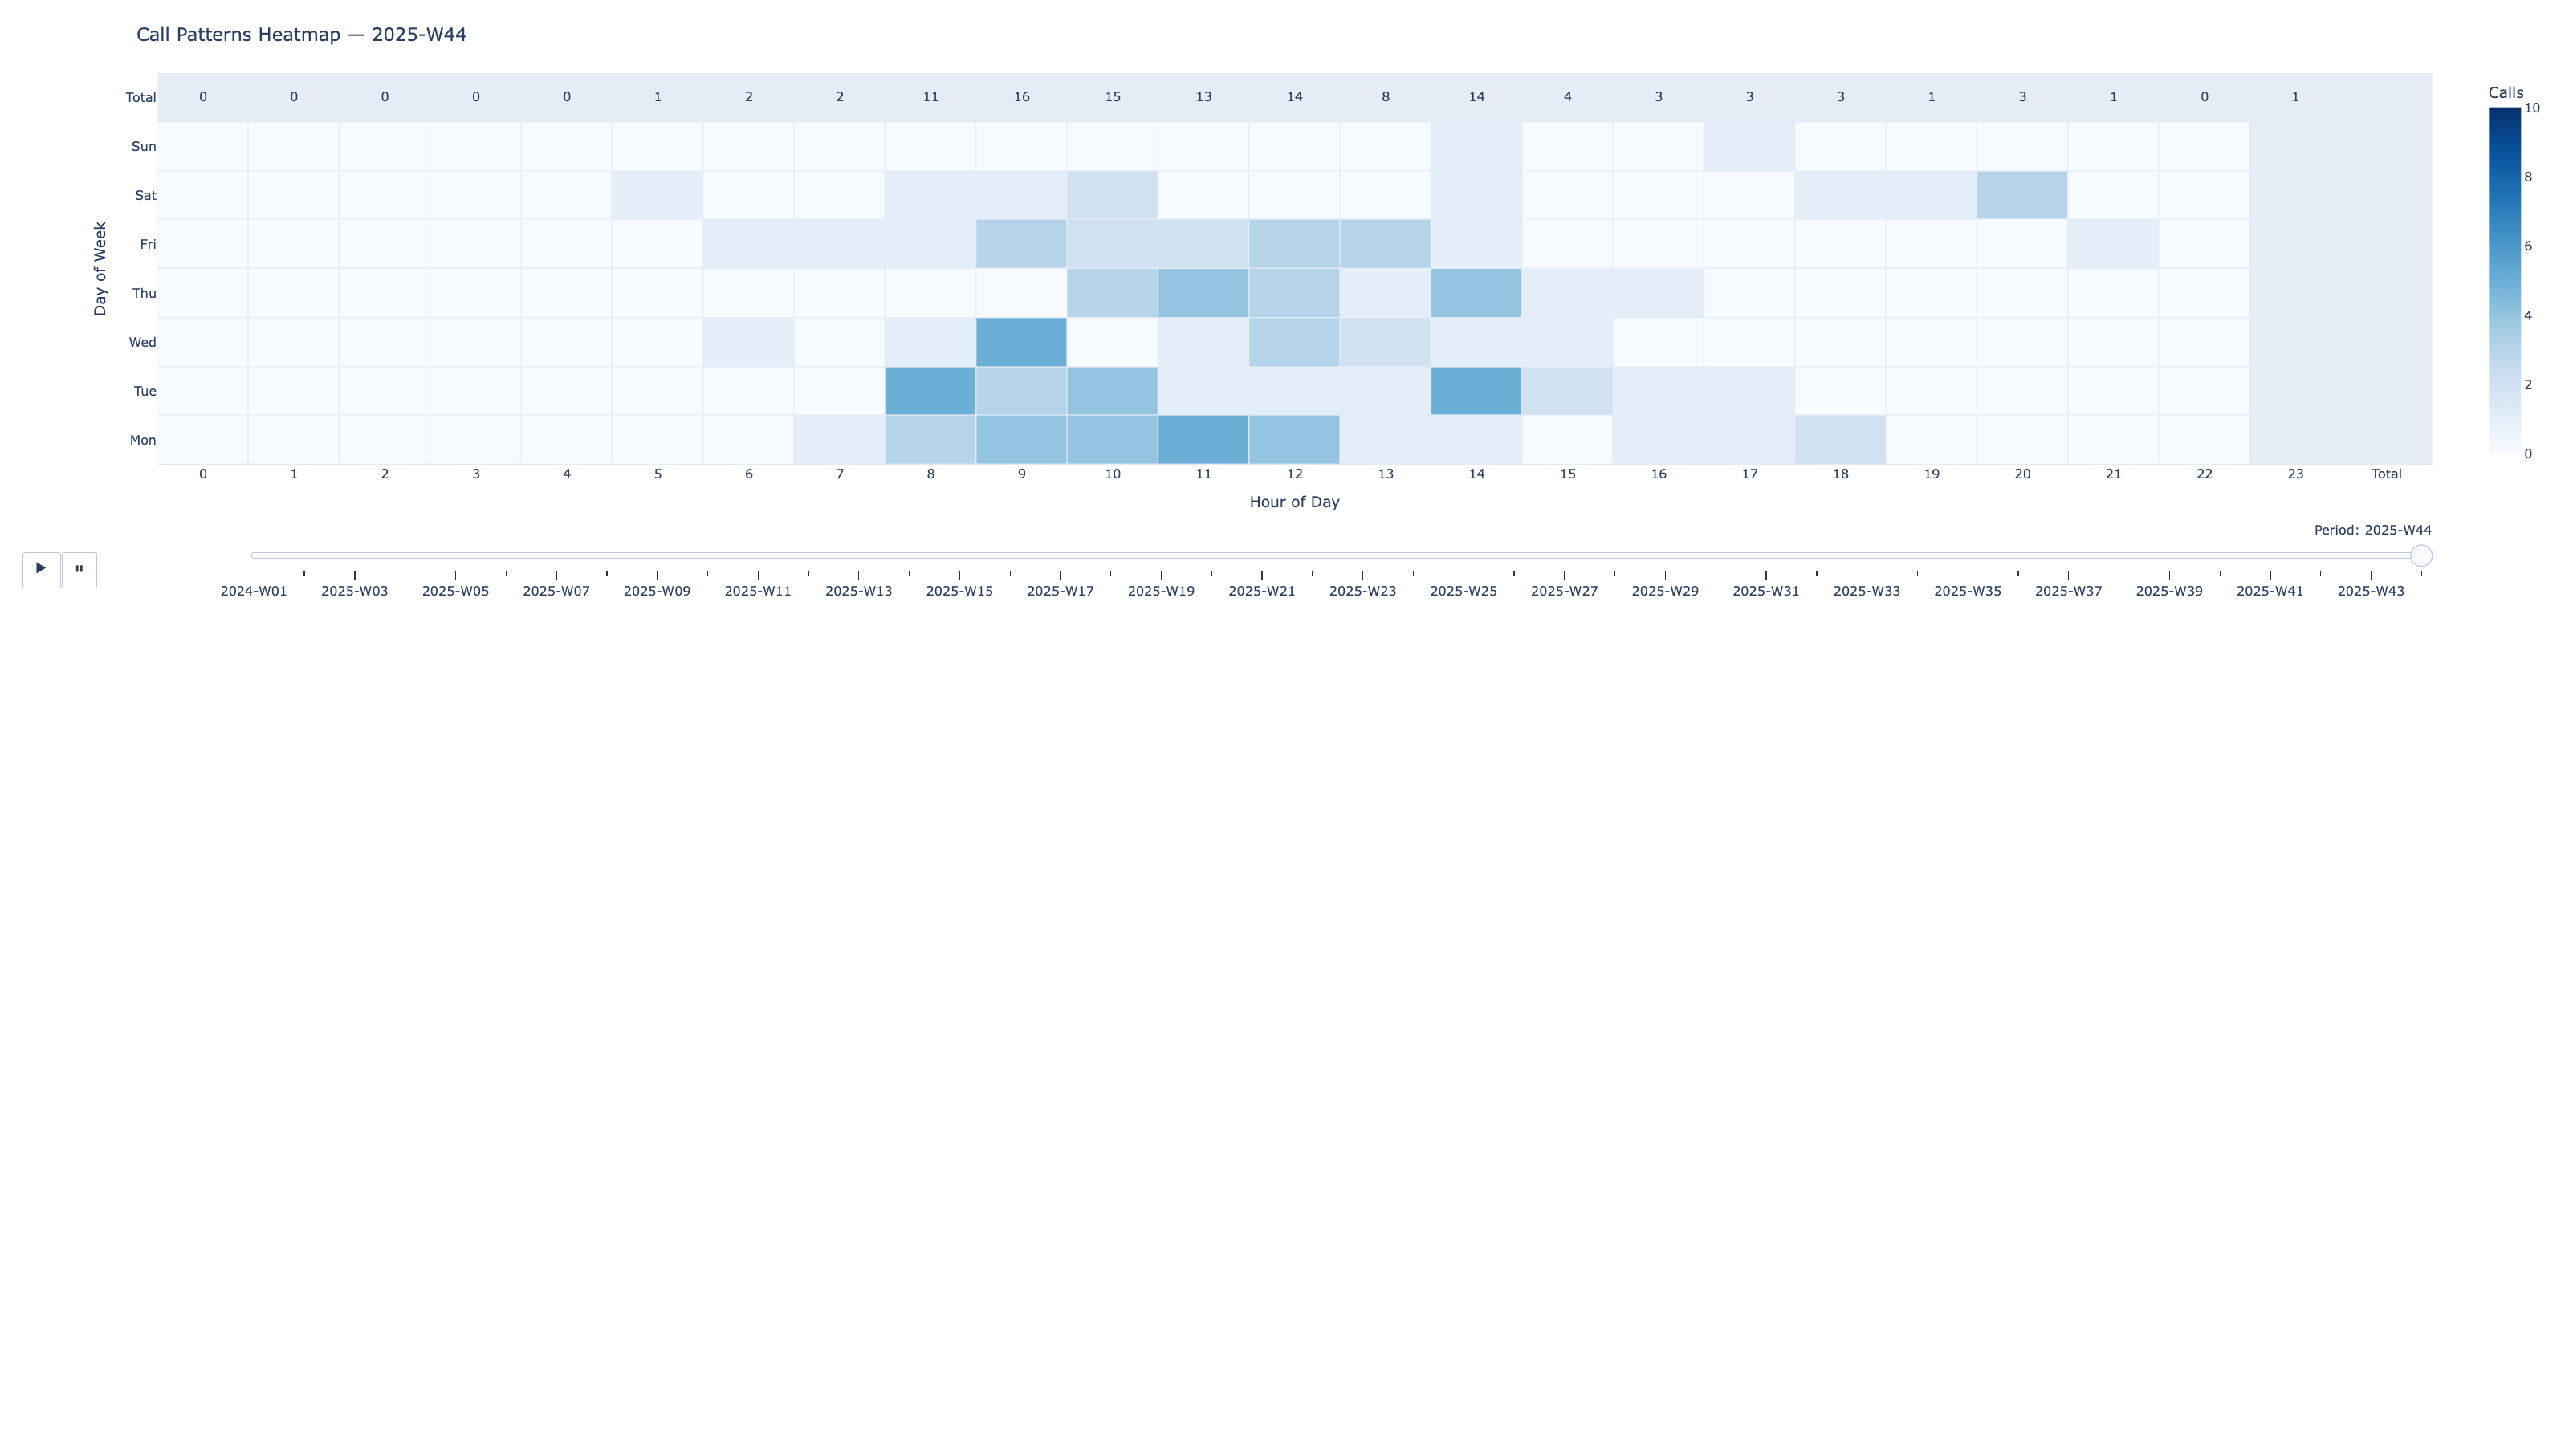
A WCS team member opens a password-protected web dashboard and sees weekly call volume, talk-time, and lead-quality metrics without touching a spreadsheet. The pipeline pulls call records from CallTrackingMetrics, has OpenAI's gpt-5-nano classify each call's intent/outcome/sentiment and sales-funnel stage (PROSPECT to CUSTOMER), then renders the results as interactive Plotly charts, a call-pattern heatmap, and a status-transition Sankey diagram, refreshed by a Cloud Scheduler job every morning.
- 01Fetches and normalizes call records from the CallTrackingMetrics API
- 02Classifies each call's intent, outcome, and sentiment with OpenAI gpt-5-nano
- 03Tracks each caller through a PROSPECT → MQL → SQL → OPPORTUNITY → CUSTOMER funnel
- 04Renders interactive Plotly dashboards: KPI tiles, a call-volume heatmap, and a funnel Sankey diagram
Screenshot walkthrough
How to use Call Tracking Intelligence.
Current status & what's next
Where it stands.
Deployment unreachable
Next phases
Stack
Built with.
Python (Flask + pandas + Plotly)OpenAI gpt-5-nanoGoogle Cloud Run + Cloud Scheduler + Cloud StorageTerraformLet's build what's next
Want Call Tracking Intelligence working for you?
Turns every inbound call into classified pipeline intelligence.
Get in touchNext product
Content Generator